

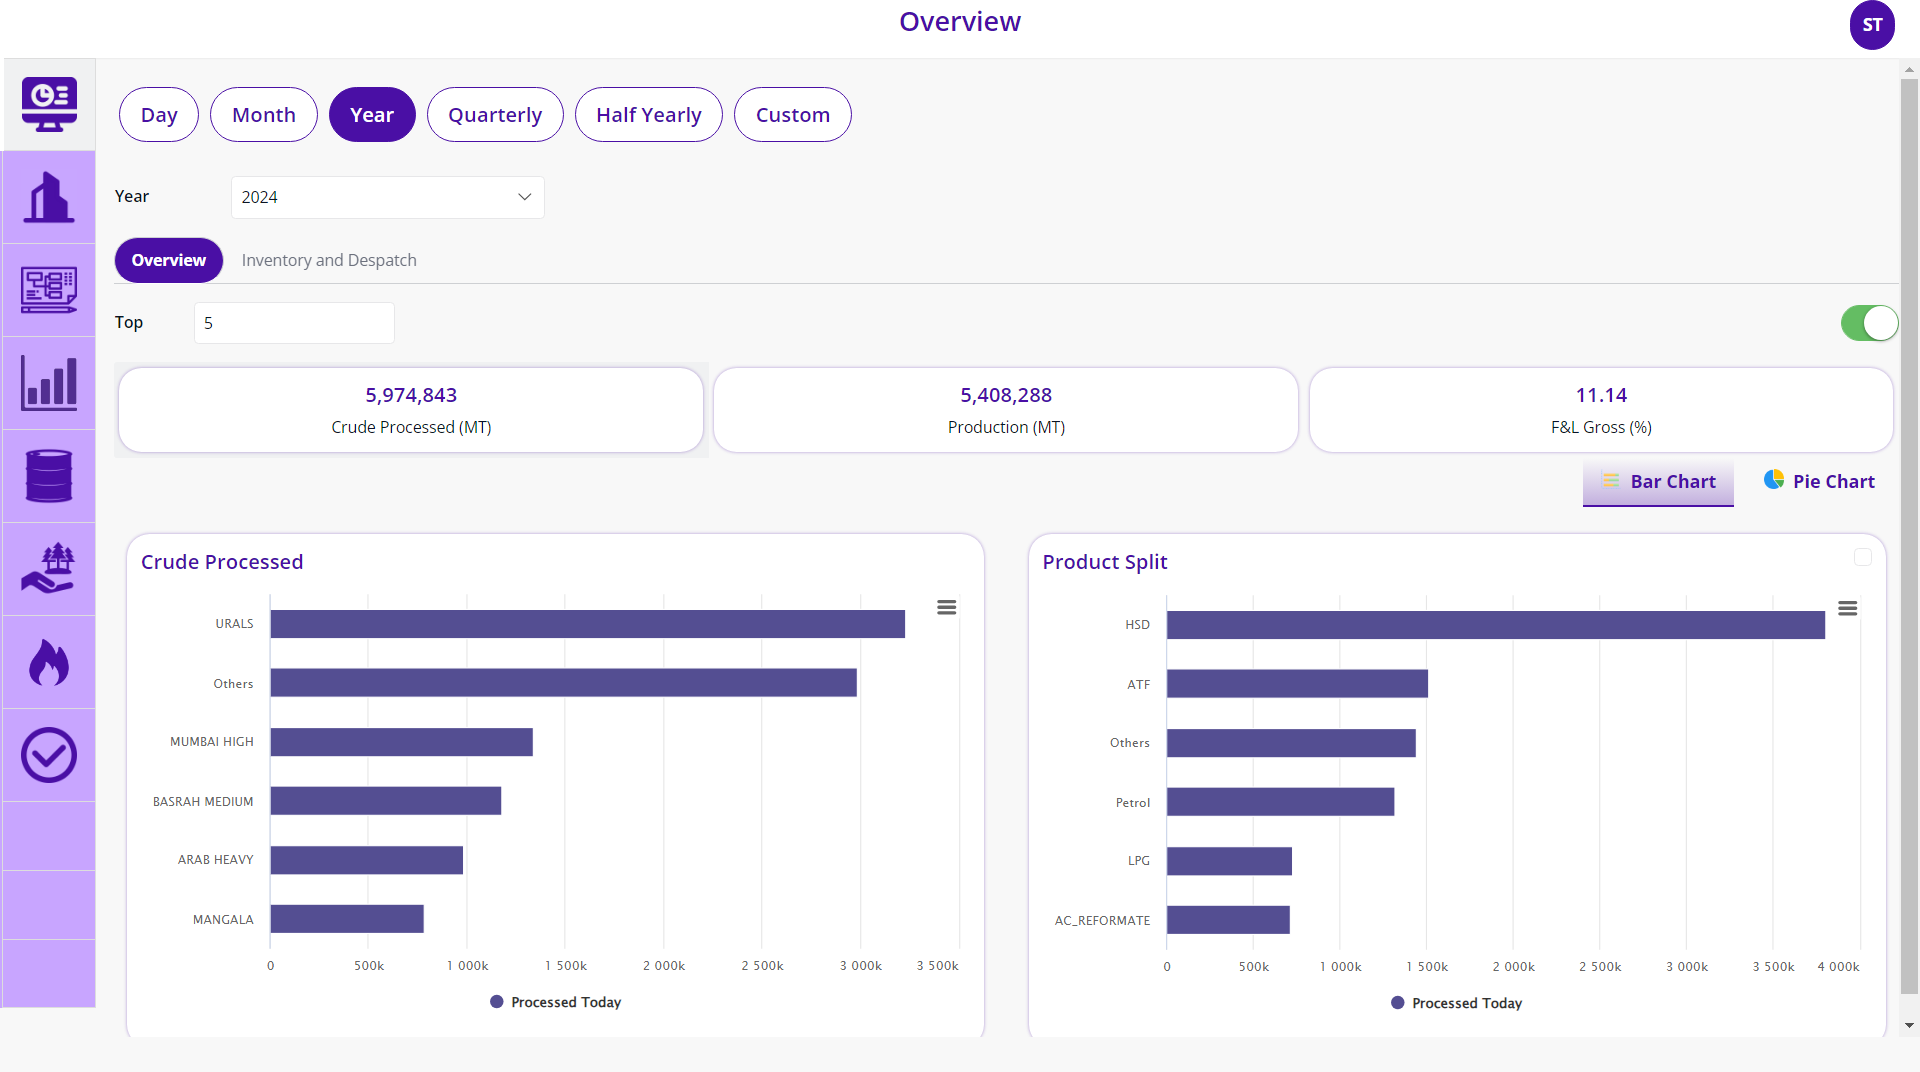
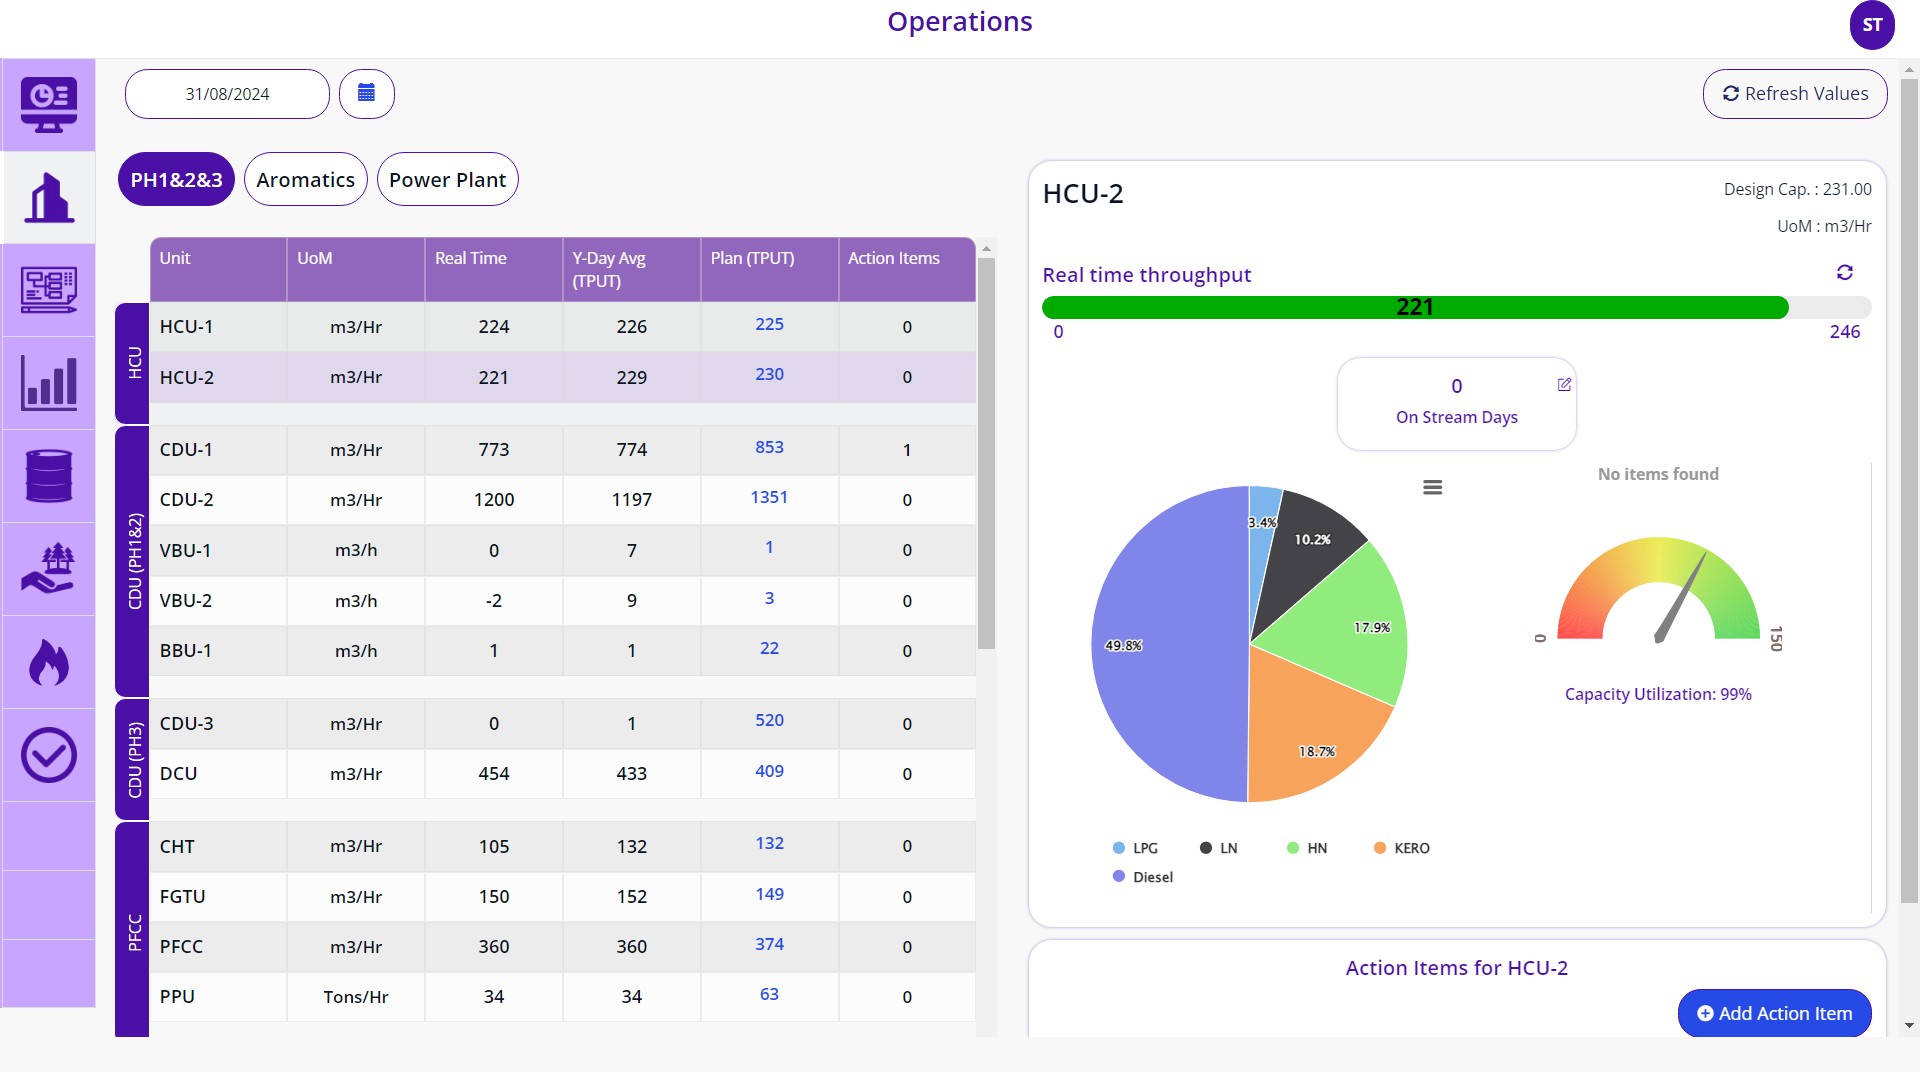
Centralized Overview Dashboard acing as Refineries Balance Sheet. Data being pulled live from Oracle Database which at its core is receiving data from a Distributed Control System interacted over a Process Historian Database.
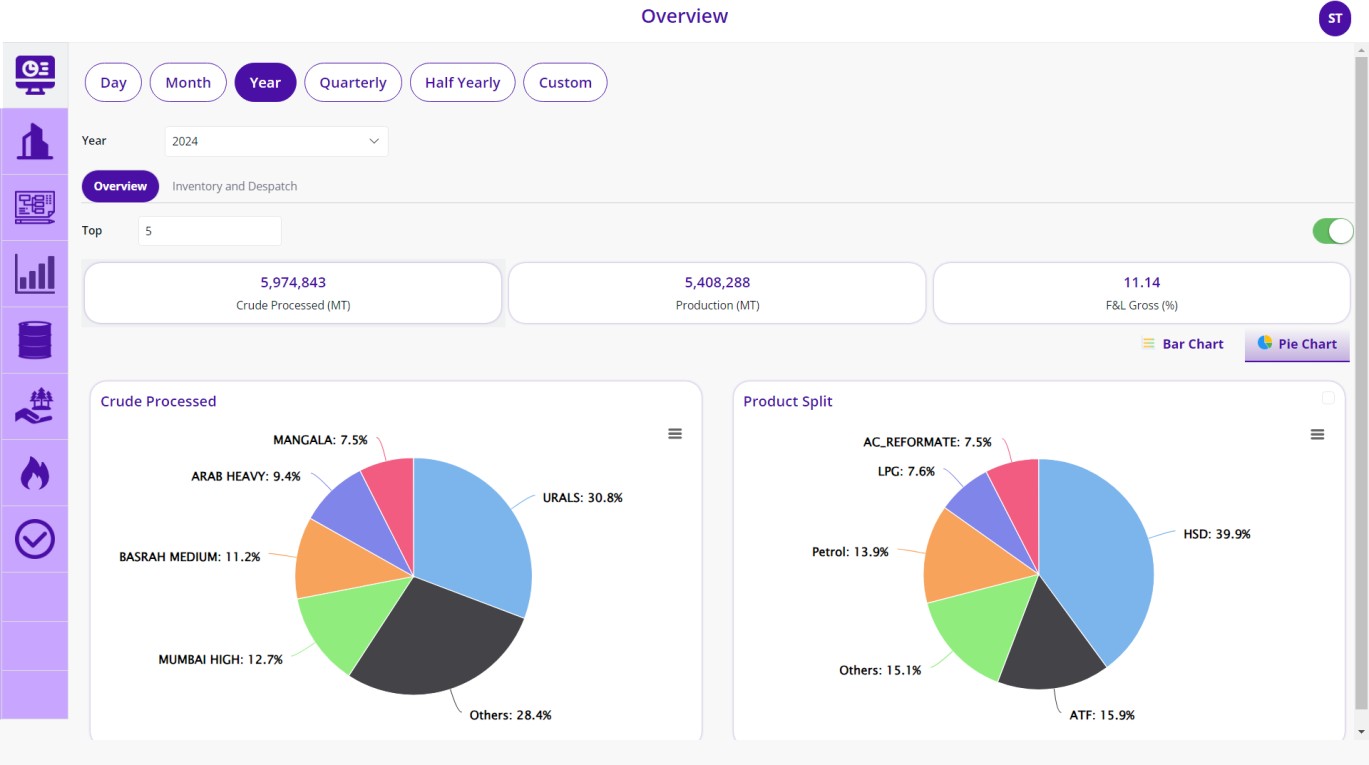
Centralized Overview Dashboard acing as Refineries Balance Sheet. Data being pulled live from Oracle Database which at its core is receiving data from a Distributed Control System interacted over a Process Historian Database.
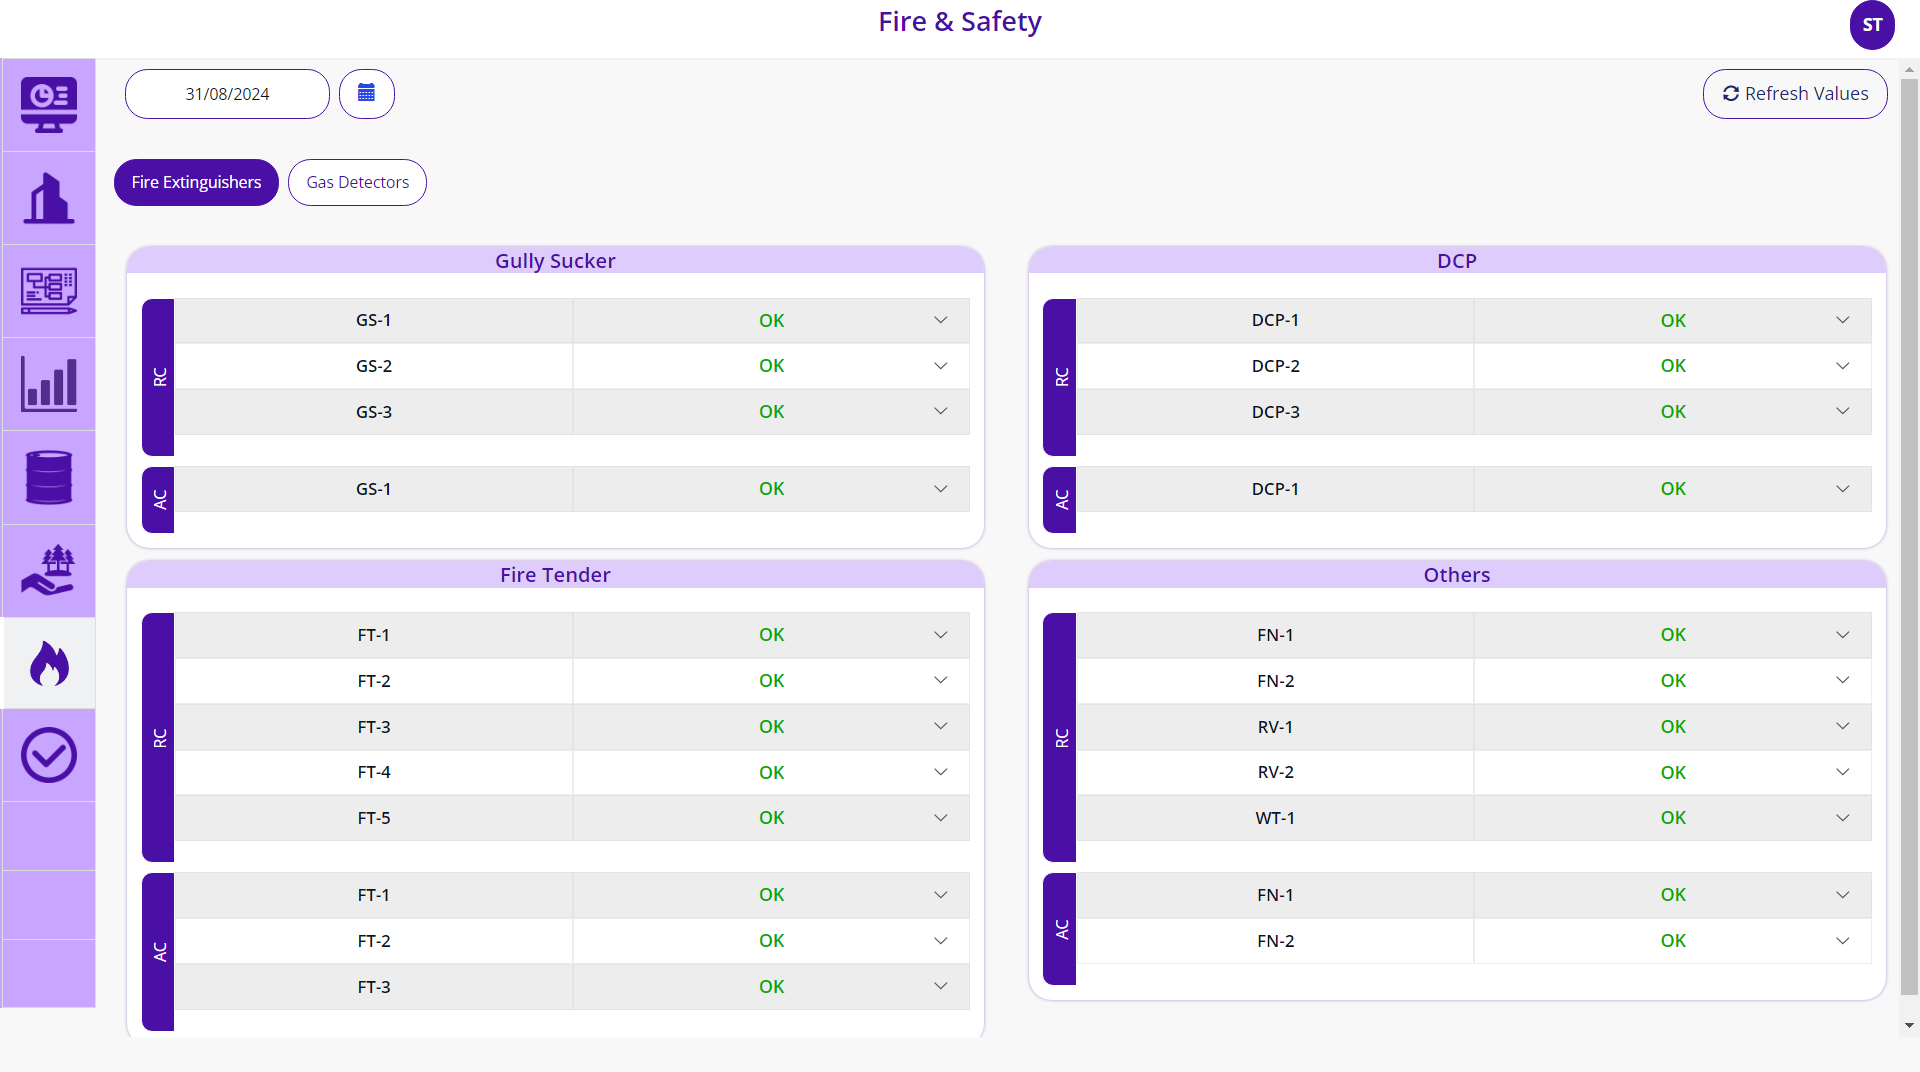
Status of Powerplants and Boiles giving a fair idea of the current status of the Refineries Power Streams/Sources. Interacting Live with an Oracle Database to fetch and process clean data for accurate and efficient analytical and graphical representations with the aid of Charts
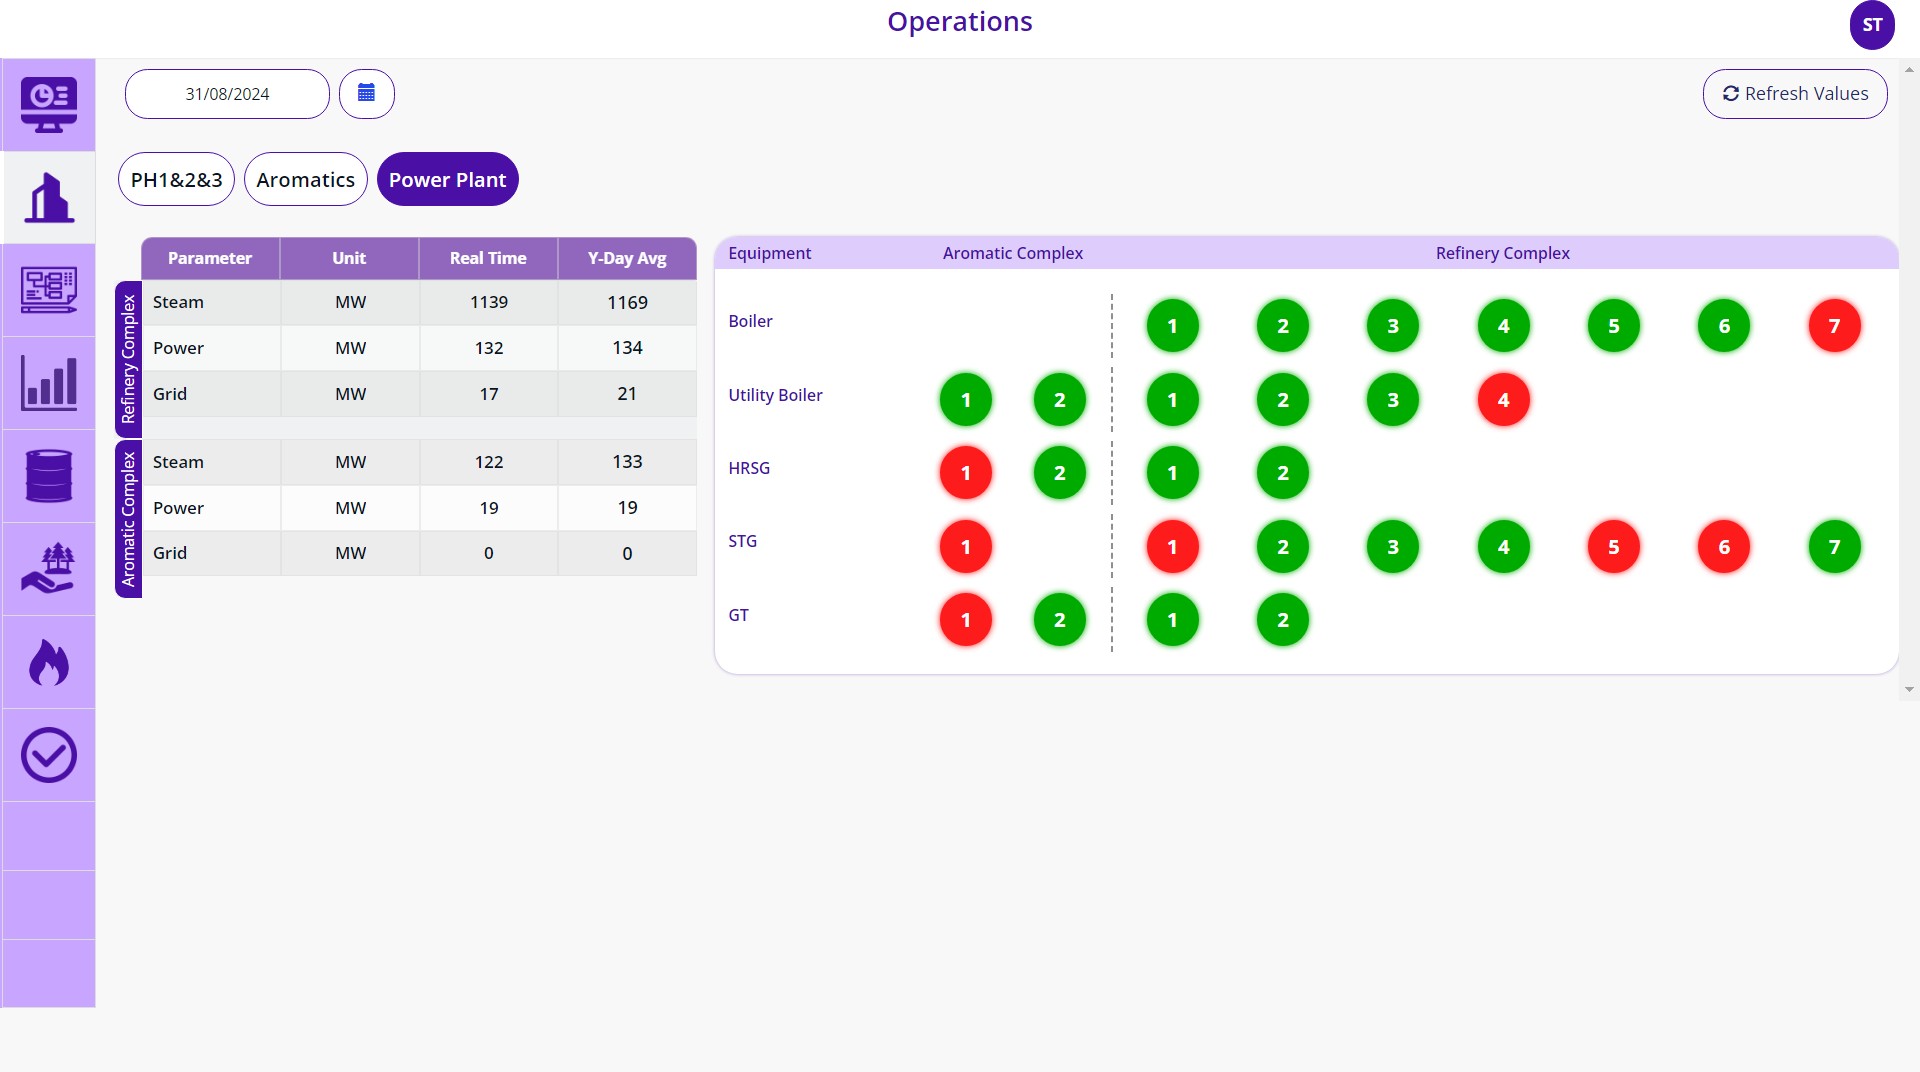
Status of Powerplants and Boiles giving a fair idea of the current status of the Refineries Power Streams/Sources. Interacting Live with an Oracle Database to fetch and process clean data for accurate and efficient analytical and graphical representations with the aid of Charts.
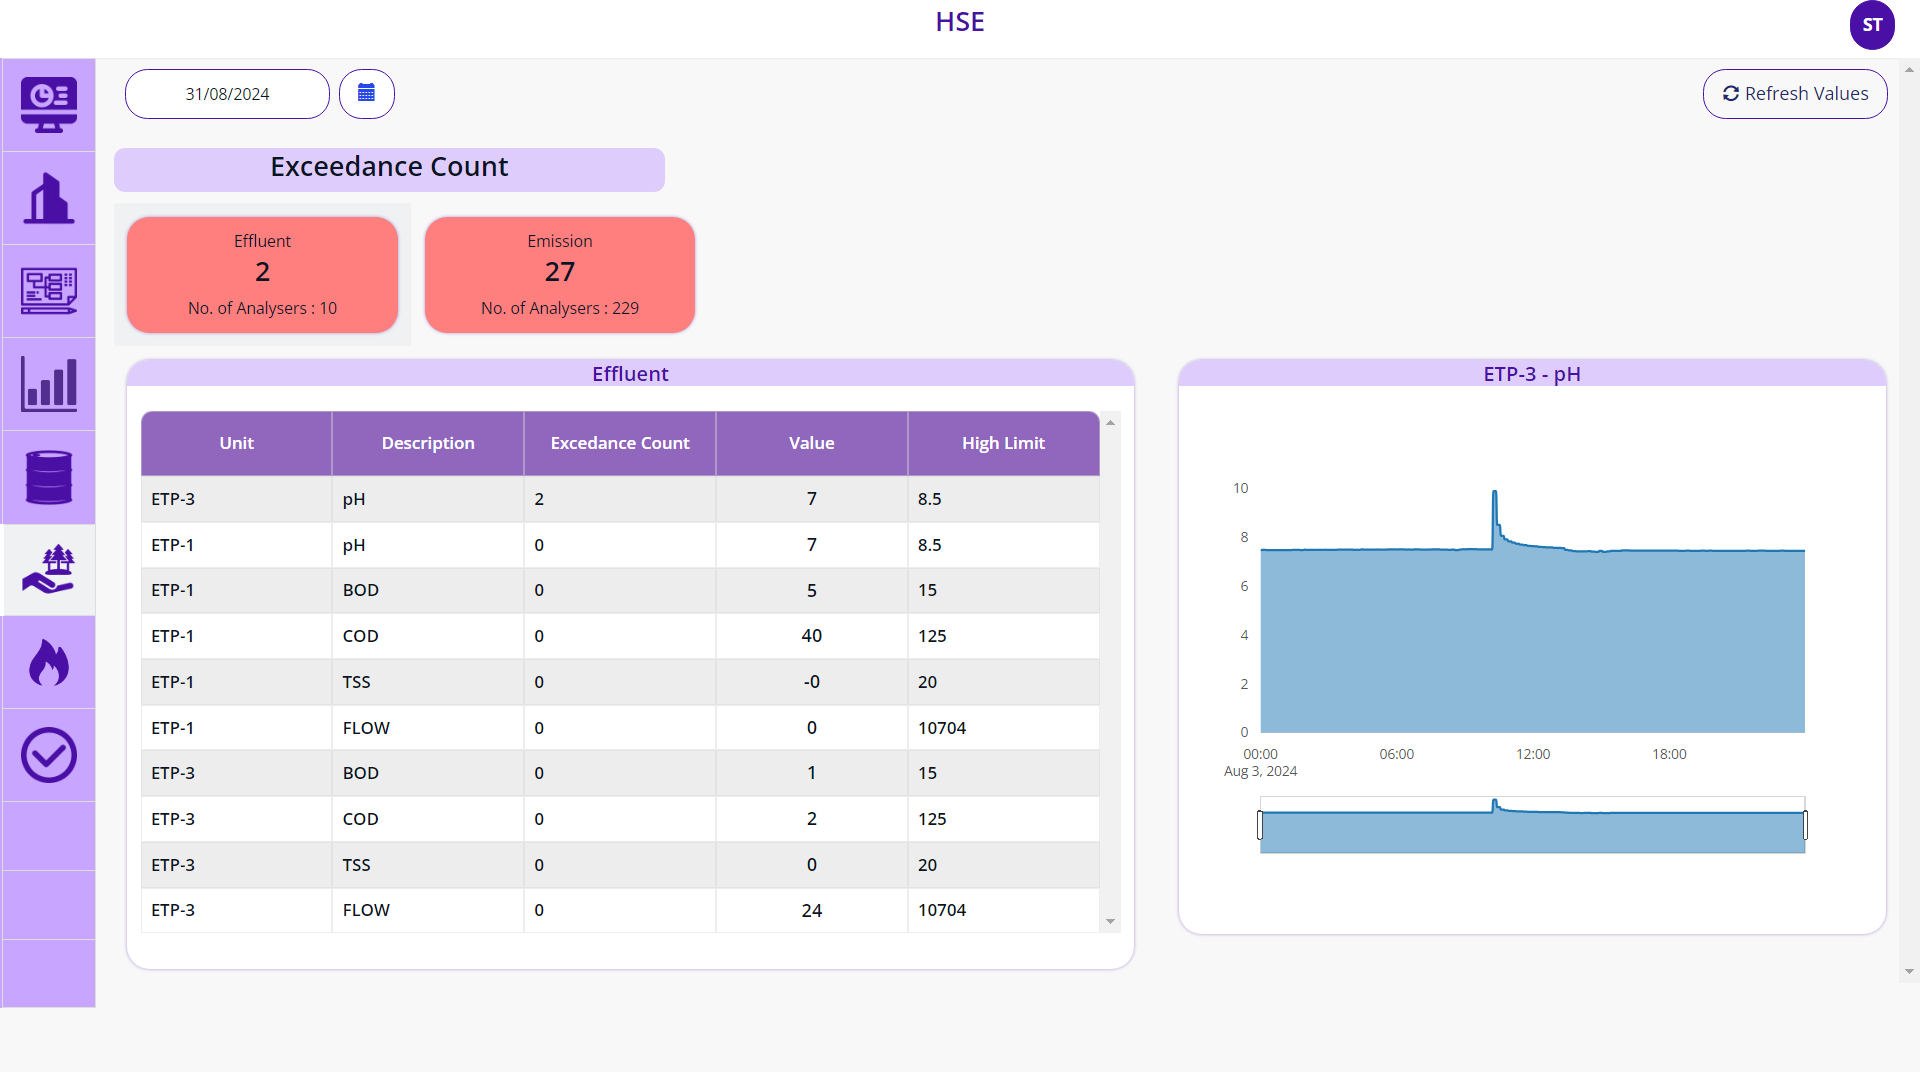
Interacting seamlessly with the Distributed Control System to fetch Live Information of Environmental Emissions and Effluence in the premises with Analytical Insights down to every minute in the last 24 hour.
Current status and information on Industrial Vehicles used inside the premises.
